Peril Markets
Prediction markets make risk modeling easier.
A standardized basket of event contracts can create better forecasts that matter for insurance. Exchanges list them, speculators trade competing views, and their prices become a shared forecast signal.
The opportunity
Insurance decisions require comprehensive analysis to model risk. Modeling requires expensive data collection, processing, and professional analytical analysis. A prediction market could provide an accurate forecast as a byproduct of price discovery.
We are betting that informed trading with sufficient liquidity will produce forecasts that are more cost effective and accurate than professionally modeled forecasts. A robust basket of credible markets will give insurance analysis a shared, continuously updated reference.
How it works
We define the market rules around the defined peril. Then exchanges list these markets to attract trading volume. Market participation is driven by speculators and hedgers like reinsurers with financial interests tied to the event outcome. Together, the event market prices present a high quality forecast that can be integrated into custom policies as well as an avenue for risk transfer.
Benefits of Peril Markets
Better Risk Analysis
A healthy active market price will reflect the analysis and data of all participants, giving a much greater depth of analysis than a single firm may produce.
Responsive Repricing
Prediction markets are trading 24/7 as events occur and more data becomes available the market is constantly repricing. This allows for risk models to be constantly update to date and quoting policies.
Reinsurance Opportunity
Instead of relying on brokers and individual firms as a partner to transfer reinsurnace risk, the public markets may directly provide that service with better pricing and lower structural fees.
A precedent in interest rates
Finance already uses prediction market prices to model forecasts for Federal Reserve decisions. CME FedWatch derives rate probabilities from futures prices. A 2026 working paper published by the Federal Reserve found Kalshi’s rate forecasts as accurate as professional forecasts about five months ahead, while providing continuously updated distributions.
Explore the forecast comparison
FOMC Federal Funds Rate Forecast Errors Comparison
Average forecast error at different distances from a Fed decision, using observations since 2022. Lower error means greater accuracy. The horizontal axis moves from 160 days ahead toward the decision.
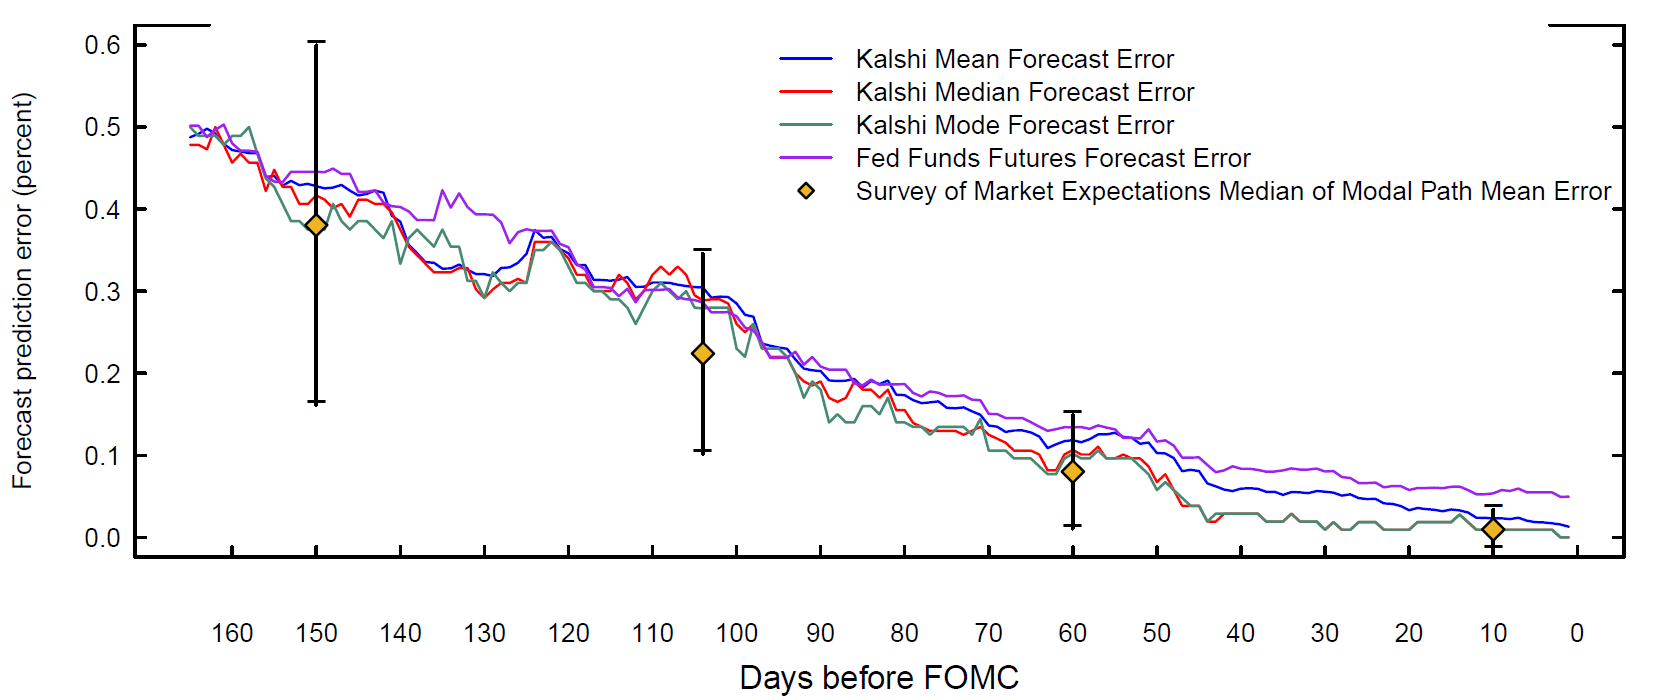
Figure 1 — Diercks, Katz and Wright, Kalshi and the Rise of Macro Markets, February 2026, FEDS 2026-010. Source: Board of Governors of the Federal Reserve System, printed page 4.
Survey bars show half a standard deviation of forecast errors, not confidence intervals. The study’s main results use last-trade prices; this chart does not establish executable prices or insurance forecasting performance. These are the authors’ preliminary findings, not a Federal Reserve endorsement.
Insurance Related Case Studies
Rhine River Water Level
Shallow water can disrupt cargo movement and increase transport costs. A market on low-water duration could inform a matching parametric quote and seasonal risk updates.
How many days will the Kaub gauge be below the agreed level?
Explore the Rhine case study →California wildfire
Wildfire perils pose significant statewide indemnity risk. Contracts on CAL FIRE’s reported annual count could provide a forecast in aggregate risk assessment.
How many structures will CAL FIRE report destroyed this year?
Explore the wildfire case study →PFAS contamination
PFAS in untreated groundwater can create treatment and liability exposure. Markets on a fixed group of Orange County wells could offer a shared outlook for regional risk analysis.
How many of the 25 wells will have an annual PFOA reading of at least 10 ng/L?
Explore the PFAS case study →